North Barrington, IL, Real Estate
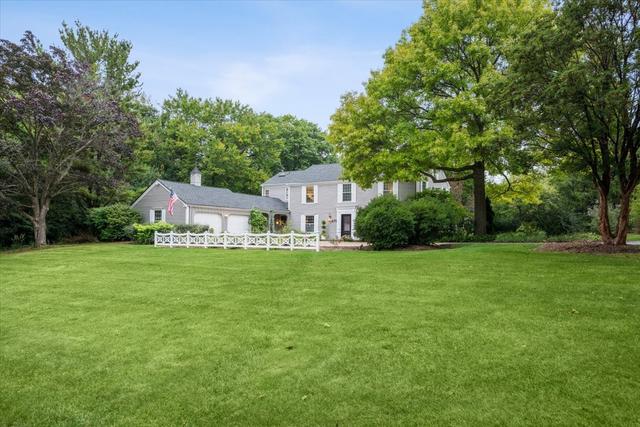
North Barrington, Illinois, is an affluent village in Lake County, located about 35 miles northwest of Chicago. With a population of approximately 3,000, this serene community is known for its picturesque landscapes, featuring wooded areas, rolling hills, and several lakes, including Honey Lake and Grass Lake. North Barrington offers a blend of rural charm and upscale living, with large, elegant homes and expansive estates. The village is part of the highly regarded Barrington 220 School District, making it attractive to families. Its proximity to the Fox River and numerous parks provides ample opportunities for outdoor activities like hiking, biking, and boating, creating a tranquil yet sophisticated lifestyle.
North Barrington currently has 17 single family homes for sale with an average list price of $1,314,864.71 and 3 lots for sale with an average list price of $416,233.33. The average annual property tax for North Barrington is $16,498.39.
Photos
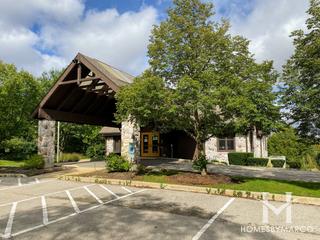 2 Photos
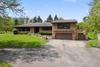
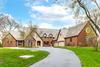
Schools
View schools in North Barrington
Recent Sales
View recent sales in North Barrington
Subdivisions
|
Subdivisions |
Median Price |

|
Biltmore is a single-family home community in North Barrington, Illinois, built between 1998 and 2007. It currently has 3 single family homes for sale with an average list price of $757,966.67. The homes range in size from 1,196 ft2 to 9,699 ft2. The average annual property tax for Biltmore is $10,515.62. It is located in Lake County. Biltmore is a single family home neighborhood in North Barrington, Illinois. Biltmore is located on Barrington Road north of Route 22.
... Read more
|
Median Price: $630,000 |

|
Brook Forest is a subdivision in North Barrington, Illinois. It currently has no homes for sale. It is located in Lake County. Brook Forest is a single family home subdivision built in the 1990's. Brook Forest is located in North Barrington, Illinois on Brook Forest Lane south of Route 22.
... Read more
|
|

|
Christopher Pines is a single-family home community in North Barrington, Illinois, built between 1989 and 1991. It currently has no homes for sale. The homes range in size from 3,808 ft2 to 4,919 ft2. The average annual property tax for Christopher Pines is $15,474.47. It is located in Lake County. Christopher Pines is a single family home subdivision built in the late 1980's and early 1990's. Christopher Pines is located in North Barrington, Illinois south of Route 22 and east of Rainbow Road.
... Read more
|
Median Price: $940,000 |
|
|
Clover Hill Farms is a subdivision in North Barrington, Illinois. It currently has no homes for sale. It is located in Lake County. Clover Hill Farms is a single family home neighborhood. Clover Hill Farms is located in North Barrington, Illinois south of Miller Road and west of Route 12/Rand Road.
... Read more
|
|

|
Grassmere Farms is a single-family home community in North Barrington, Illinois, built between 1991 and 2006. It currently has 1 lot for sale with a list price of $599,000. The homes range in size from 4,678 ft2 to 11,500 ft2. The HOA fees range from $33 to $45 per month. The average annual property tax for Grassmere Farms is $21,698.34. It is located in Lake County. Grassmere Farms is a single family home neighborhood built starting in the mid 1990's. Grassmere Farms is located in North Barrington, Illinois south of Route 22 and east of Hough Road.
... Read more
|
Median Price: $1,567,500 |
Show all 11 Subdivisions
Subdivisions
View subdivisions in North Barrington
Market Trends
North Barrington home sales for the month of April decreased in volume by 25% when compared to last year, while the median sale price rose by 1.6% from $763,000 to $775,000. House sales decreased by 25%, while the median sale price rose by 1.6% from $763,000 to $775,000.
|
65
|
49
|
45
|
57
|
|
2022 |
2023 |
2024 |
2025 |
|
$830,000
|
$760,000
|
$990,000
|
$946,000
|
|
2022 |
2023 |
2024 |
2025 |
Median Sale Price for North Barrington
Number of Sales for North Barrington
Market Trends
View market trends in North Barrington
Nearby Parks
Eton Drive
Basketball Courts
Playground
Soccer Fields
Cross-Country Skiing
Fishing
Hiking Paths
Shady Lane and Oxford Road
Nearby Parks
View parks in North Barrington
Nearby Golf Courses
160 Biltmore Dr, Barrington, IL 60010
Par 71 • 71 holes • 6595 yards
Nearby Golf Courses
View golf courses near Grassmere Farms
Real Estate News
|
North Barrington had 2 new homes for sale with a master bedroom on the first floor during the month of Saturday, May 9 to Friday, May 15, including 2 ...
continue reading
|
|
|
North Barrington had 2 new homes for sale during the week of Friday, May 8 to Thursday, May 14, including including 2 single family homes for sale with an average ...
continue reading
|
|
North Barrington had only 1 new home backing up to golf courses for sale during the week of Tuesday, May 5 to Monday, May 11, and it was a single ...
continue reading
|

|
North Barrington had 2 sales during the week of Tuesday, May 5 to Monday, May 11, including including 2 single family homes for sale with an average list price of ...
continue reading
|

|
North Barrington had only 1 new home for sale during the week of Friday, May 1 to Thursday, May 7, including and it was a single family home for sale ...
continue reading
|
View More North Barrington News
Real Estate News
View More North Barrington News
We have helped thousands of families buy and sell homes!
HomesByMarco agents are experts in the area. If you're looking to buy or sell a home, give us a call today at 888-326-2726.