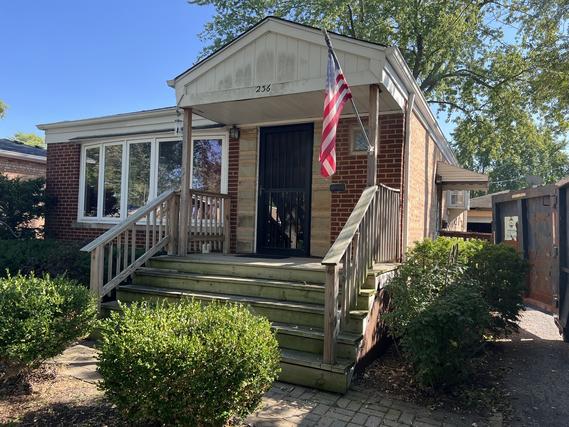
South Chicago Heights, IL, Real Estate
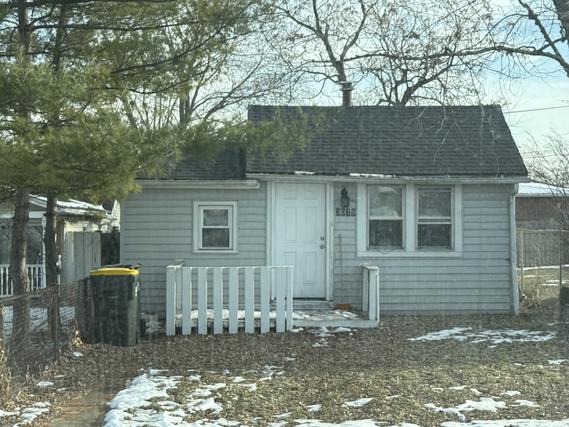
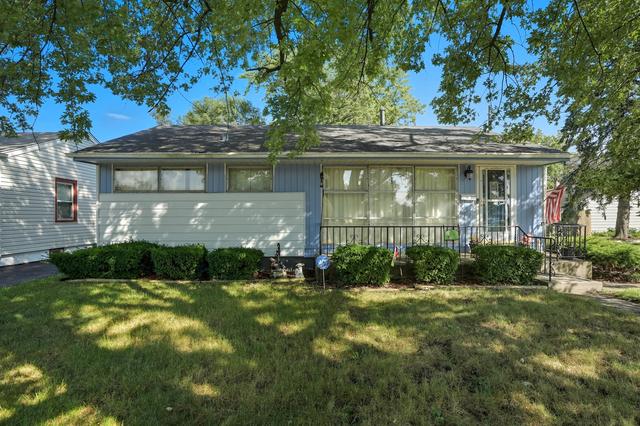
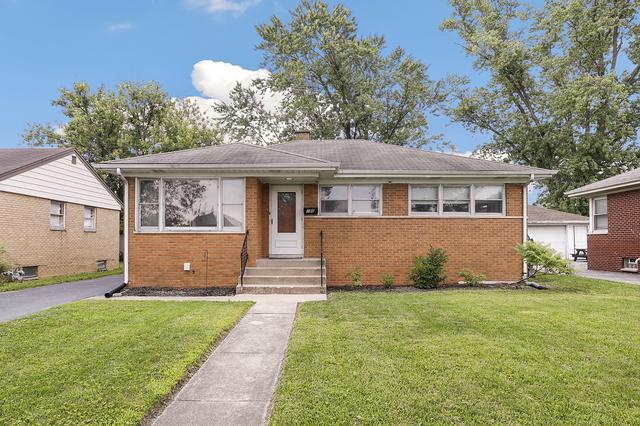
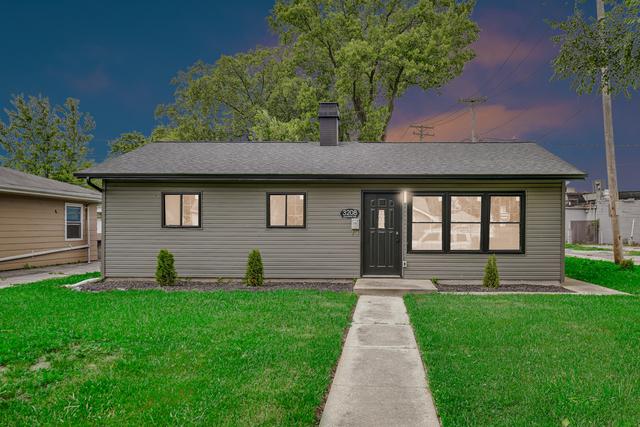
South Chicago Heights, Illinois, is a small village in Cook County, located about 30 miles south of downtown Chicago. With a population of around 4,000, it’s a tight-knit community known for its industrial history and diverse, working-class roots. The village offers a quiet, suburban feel with affordable housing, local parks like Memorial Park, and a strong sense of neighborhood pride. Its proximity to major highways and the city of Chicago makes it a convenient spot for commuters, while local businesses and community events, like summer festivals, foster a welcoming atmosphere. South Chicago Heights also benefits from its access to nearby educational and cultural resources, blending small-town charm with urban connectivity.
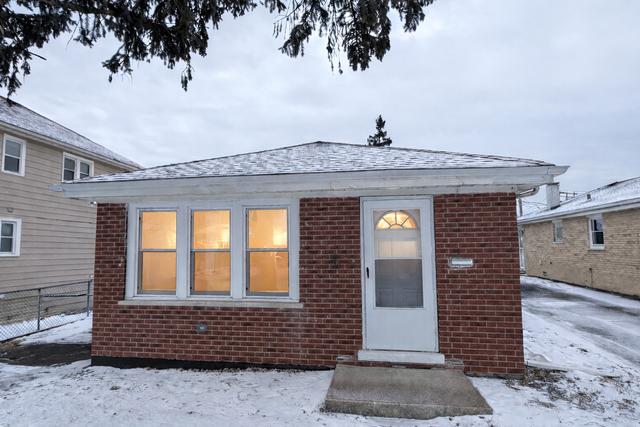
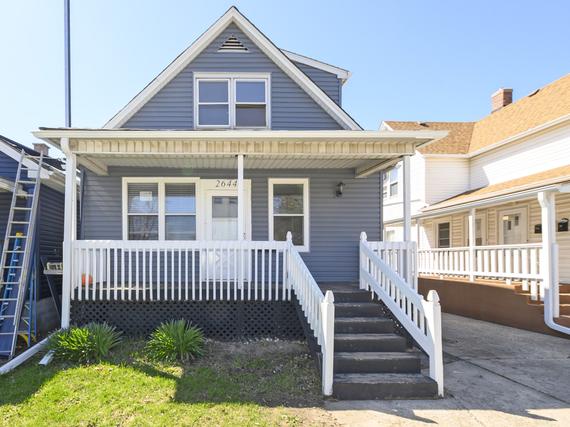
South Chicago Heights currently has 7 single family homes for sale with an average list price of $196,300. The average annual property tax for South Chicago Heights is $2,712.24.
Browse South Chicago Heights
Using the absorption rate, we can determine how long it's taking for homes to sell and which price points are selling the fastest in South Chicago Heights, i.e. what's hot and what's not.
See What's Hot & What's Not in South Chicago Heights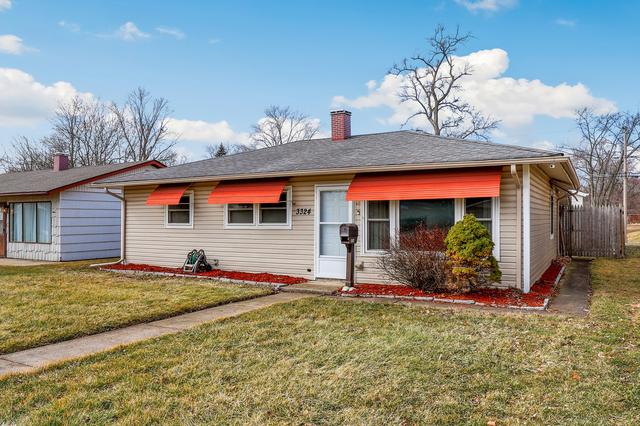

Market Trends
South Chicago Heights home sales for the month of March decreased in volume when compared to last year, while the median sale price decreased. House sales decreased, while the median sale price decreased.
|
42
|
32
|
33
|
28
|
| 2022 | 2023 | 2024 | 2025 |
| # of sales per year | |||
|
$162,500
|
$171,000
|
$180,000
|
$184,000
|
| 2022 | 2023 | 2024 | 2025 |
| median sale price per year | |||
Median Sale Price for South Chicago Heights
Number of Sales for South Chicago Heights


We have helped thousands of families buy and sell homes!
HomesByMarco agents are experts in the area. If you're looking to buy or sell a home, give us a call today at 888-326-2726.