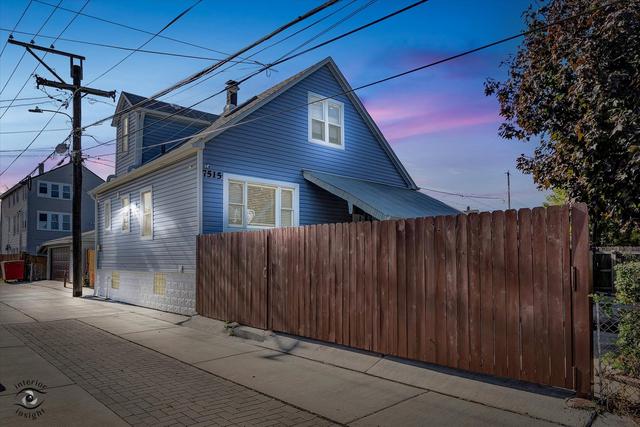
Summit, IL, Real Estate
Summit, Illinois, is a small village in Cook County, located just southwest of Chicago, with a population of around 11,000 as of the 2020 census. Known for its industrial roots and diverse community, Summit is home to the Argo Corn Products plant, a major producer of corn-based products, which has long been a cornerstone of the local economy. The village offers a mix of residential and commercial areas, with easy access to Chicago via major highways and public transit, including the Metra commuter rail. Summit maintains a tight-knit, working-class vibe, with local parks, schools, and community events fostering a sense of pride among residents, many of whom value its affordability and proximity to urban amenities.
Summit currently has 11 single family homes for sale with an average list price of $294,536.36, 1 townhouse for sale with a list price of $274,900, and 3 lots for sale with an average list price of $390,000. The average annual property tax for Summit is $4,778.03.
Browse Summit
Using the absorption rate, we can determine how long it's taking for homes to sell and which price points are selling the fastest in Summit, i.e. what's hot and what's not.
See What's Hot & What's Not in Summit

Market Trends
Summit home sales for the month of February rose in volume by 100% when compared to last year, while the median sale price decreased by 0.6% from $315,000 to $313,000. House sales stayed the same, while the median sale price decreased by 1.3% from $315,000 to $311,000. Townhouse sales decreased, while the median sale price decreased.
|
48
|
33
|
30
|
37
|
| 2022 | 2023 | 2024 | 2025 |
| # of sales per year | |||
|
$240,000
|
$239,900
|
$278,000
|
$260,000
|
| 2022 | 2023 | 2024 | 2025 |
| median sale price per year | |||
Median Sale Price for Summit
Number of Sales for Summit


We have helped thousands of families buy and sell homes!
HomesByMarco agents are experts in the area. If you're looking to buy or sell a home, give us a call today at 888-326-2726.