Crestwood, IL, Real Estate
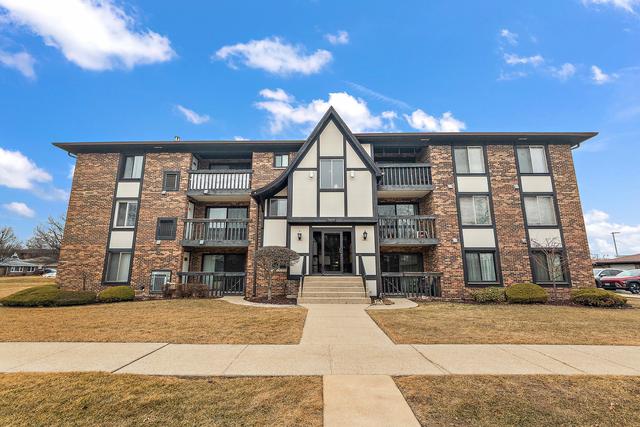
Crestwood, Illinois, is a small village located in Cook County, just southwest of Chicago. With a population of around 10,000, it offers a suburban feel with a mix of residential neighborhoods, local businesses, and community parks. Known for its affordability and proximity to the city, Crestwood attracts families and commuters seeking a quieter lifestyle with easy access to urban amenities. The village hosts events like summer festivals and maintains recreational facilities such as Walker Park, fostering a tight-knit community spirit. Its convenient location near major highways and public transit makes it a practical choice for those working in or around Chicago.
Crestwood currently has 15 single family homes for sale with an average list price of $346,786.60, 8 townhouses for sale with an average list price of $327,959.13, 20 condos for sale with an average list price of $176,012.50, and 2 lots for sale with an average list price of $383,950. The average annual property tax for Crestwood is $2,772.61.
Schools
View schools in Crestwood
Using the absorption rate, we can determine how long it's taking for homes to sell and which price points are selling the fastest in Crestwood, i.e. what's hot and what's not.
See What's Hot & What's Not in Crestwood
Recent Sales
View recent sales in Crestwood
Subdivisions
|
Subdivisions |
Median Price |

|
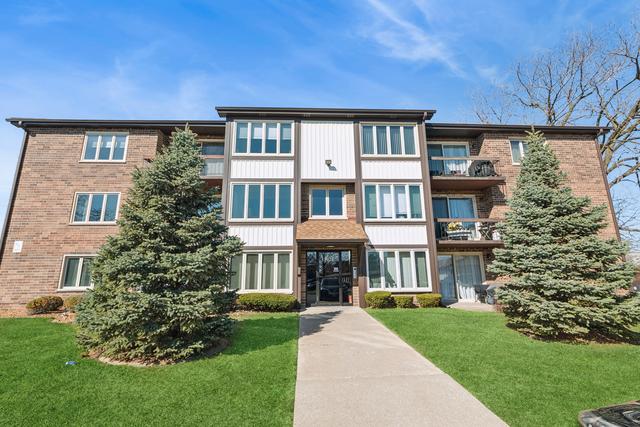
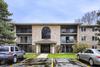
Applegate is a condo community in Crestwood, Illinois, built between 1984 and 1989. It currently has 1 condo for sale with a list price of $190,000. The homes range in size from 1,000 ft2 to 1,200 ft2. The HOA fees range from $207 to $310 per month. The average annual property tax for Applegate is $2,063.42. It is located in Cook County. Located in Crestwood, Applegate is on Laramie Blvd. North of 143rd.
... Read more
|
Median Price: $177,500 |
|
|
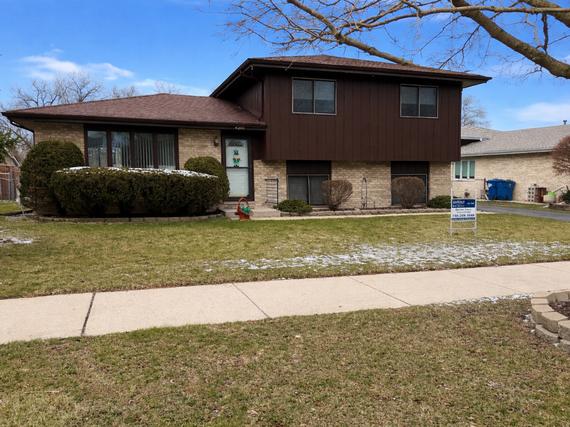
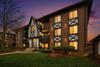
Carriage Hill is a condo and single-family home community in Crestwood, Illinois, built between 1968 and 1991. It currently has no homes for sale. The homes range in size from 800 ft2 to 2,492 ft2. The average annual property tax for Carriage Hill is $3,551.05. It is located in Cook County. Carriage Hill is a condo community built in the 1970's. Carriage Hill is located in Crestwood, Illinois west of Central Avenue and south of 127th Street.
... Read more
|
|
|
|
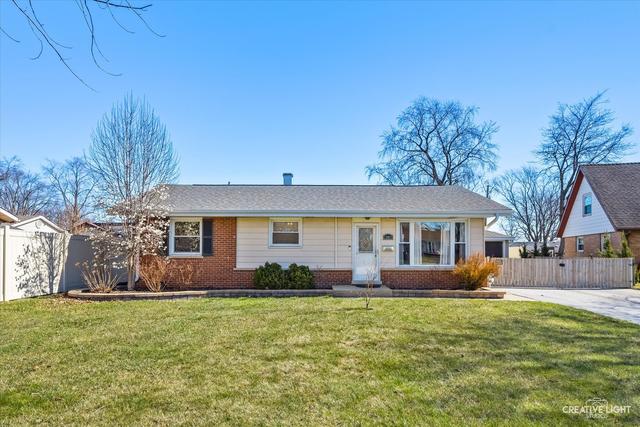
Carriage Hills East is a subdivision in Crestwood, Illinois. It currently has no homes for sale. It is located in Cook County. Carriage Hills East is a single family home subdivision built in the 1970's. Carriage Hills East is located in Crestwood, Illinois east of Central Avenue and south of 127th Street.
... Read more
|
|
|
|
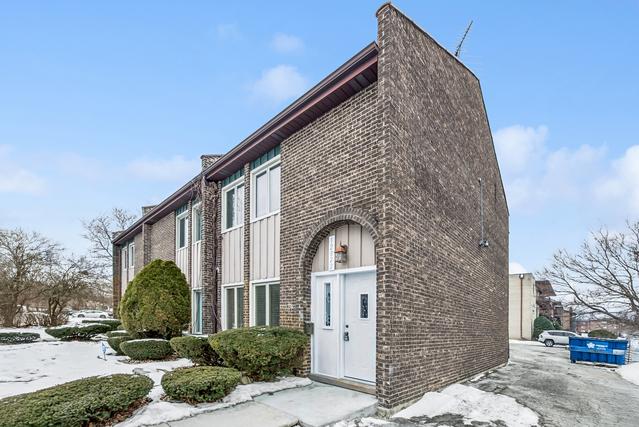
Carriage Lane is a condo community in Crestwood, Illinois, built between 1972 and 1980. It currently has 1 condo for sale with a list price of $137,500. The homes range in size from 800 ft2 to 1,000 ft2. The HOA fees range from $155 to $240 per month. The average annual property tax for Carriage Lane is $1,234.22. It is located in Cook County. Carriage Lane is a condo community built in the early 1970's. Carriage Lane is located in Crestwood, Illinois on Carriage Lane south of 127th Street.
... Read more
|
Median Price: $150,000 |
|
|
Carriage Place is a condo community in Crestwood, Illinois, built in 1971. It currently has 1 condo for sale with a list price of $90,000. The homes have an average size of 800 ft2. The HOA fees range from $181 to $181 per month. The average annual property tax for Carriage Place is $1,983. It is located in Cook County. Condominiums built in the late 1970s and located in Crestwood south of 127th Street and west of Central Avenue.
... Read more
|
|
Show all 36 Subdivisions
Subdivisions
View subdivisions in Crestwood
Market Trends
Crestwood home sales for the month of April decreased in volume by 42.9% when compared to last year, while the median sale price rose by 3.2% from $186,500 to $192,500. House sales decreased by 66.7%, while the median sale price rose by 17% from $260,000 to $304,250. Condo sales decreased by 28.6%, while the median sale price rose by 28% from $144,500 to $185,000. Townhouse sales stayed the same, while the median sale price decreased by 28.8% from $330,000 to $235,000.
|
222
|
198
|
175
|
207
|
|
2022 |
2023 |
2024 |
2025 |
|
$145,000
|
$165,000
|
$179,000
|
$187,000
|
|
2022 |
2023 |
2024 |
2025 |
Median Sale Price for Crestwood
Number of Sales for Crestwood
Market Trends
View market trends in Crestwood
Nearby Parks
View parks in Crestwood
Real Estate News

|
Crestwood had 3 sales during the week of Tuesday, April 21 to Monday, April 27, including including 1 single family home for sale with a list price of $289,900, 1 ...
continue reading
|
|
Crestwood had 3 new homes for sale with a master bedroom on the first floor during the month of Saturday, April 18 to Friday, April 24, including 1 single ...
continue reading
|
|
|
Crestwood had 7 new homes for sale during the week of Friday, April 17 to Thursday, April 23, including including 4 single family homes for sale with an average list ...
continue reading
|

|
Crestwood had 2 sales during the week of Tuesday, April 14 to Monday, April 20, including including 2 condos for sale with an average list price of $172,400.
$184,900
13933 James Dr. ...
continue reading
|
|
Crestwood had 4 new homes for sale with a master bedroom on the first floor during the month of Saturday, April 11 to Friday, April 17, including 1 townhouse ...
continue reading
|
View More Crestwood News
Real Estate News
View More Crestwood News
We have helped thousands of families buy and sell homes!
HomesByMarco agents are experts in the area. If you're looking to buy or sell a home, give us a call today at 888-326-2726.