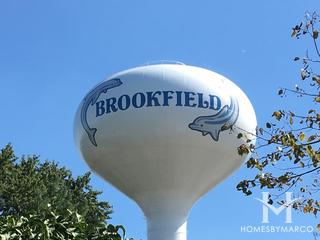
Brookfield, IL, Real Estate
Brookfield, Illinois, is a charming suburban village located just 13 miles west of downtown Chicago, offering a perfect blend of small-town feel and urban accessibility. Known for its historic Brookfield Zoo, a major attraction since 1934, the village draws visitors and locals alike to its sprawling 216-acre campus showcasing diverse wildlife and conservation efforts. With a population of around 19,000, Brookfield boasts tree-lined streets, well-preserved early 20th-century architecture, and a tight-knit community atmosphere. The village is served by the Metra rail system, making commuting to Chicago convenient, while local parks, schools, and a vibrant downtown area with shops and restaurants foster a welcoming environment for families and professionals.
Brookfield currently has 19 single family homes for sale with an average list price of $431,918.37, 4 townhouses for sale with an average list price of $357,450, 1 condo for sale with a list price of $390,000, and 1 lot for sale with a list price of $110,000. The average annual property tax for Brookfield is $7,126.86.
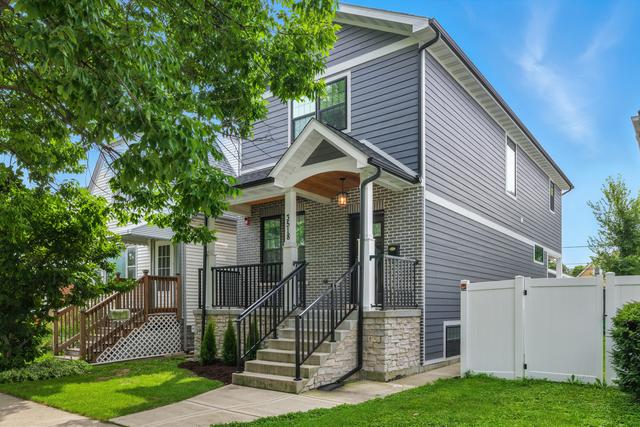
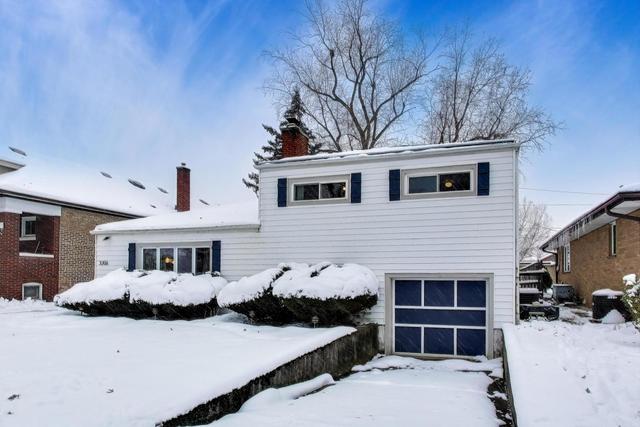
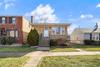
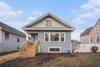
Photos
 1 Photo
Schools
View schools in Brookfield
Using the absorption rate, we can determine how long it's taking for homes to sell and which price points are selling the fastest in Brookfield, i.e. what's hot and what's not.
See What's Hot & What's Not in Brookfield
Recent Sales
View recent sales in Brookfield
Train Stations
View train stations in Brookfield
Subdivisions/Buildings
|
Subdivisions/Buildings |
Median Price |

|
3631 Forest is a condo building in Brookfield, Illinois, built between 2008 and 2011. It currently has no homes for sale. The homes range in size from 1,611 ft2 to 2,100 ft2. The HOA fees range from $320 to $372 per month. The average annual property tax for 3631 Forest is $8,231.62. 3631 Forest Avenue is an 18 unit townhouse community built starting in 2008. 3631 Forest Avenue is located in Brookfield, Illinois on Forest Avenue north of Brookfield Avenue.
... Read more
|
Median Price: $332,500 |
|
|
Brooke Court is a condo, single-family home, and townhouse community in Brookfield, Illinois, built between 1950 and 1963. It currently has no homes for sale. The homes have an average size of 1,053 ft2. The average annual property tax for Brooke Court is $5,177.28. It is located in Cook County. Brooke Court is a condominium building built in 1963. Brooke Court is located in Brookfield, Illinois on 31st Street east of Maple Avenue.
... Read more
|
|
|
|
Brookfield Manor is a single-family home community in Brookfield, Illinois, built between 1923 and 1954. It currently has no homes for sale. The average annual property tax for Brookfield Manor is $7,593.59. It is located in Cook County. Brookfield Manor is a single famly home subdivision. Brookfield Manor is located in Brookfield, Illinois south of 31st Street and east of Maple Avenue.
... Read more
|
Median Price: $332,277.50 |
|
|
Brookfield Terrace is a condo building in Brookfield, Illinois, built between 2002 and 2005. It currently has no homes for sale. The homes range in size from 950 ft2 to 1,542 ft2. The HOA fees range from $242 to $325 per month. The average annual property tax for Brookfield Terrace is $7,710.15. It is located in Cook County. Brookfield Terrace is a condominium building built in 2004. Brookfield Terrace is located in Brookfield, Illinois at 8822 Brookfield Avenue just east of Prairie Avenue.
... Read more
|
Median Price: $260,000 |
|
|
Congress Park is a single-family home community in Brookfield, Illinois, built between 1919 and 1962. It currently has no homes for sale. The homes range in size from 1,004 ft2 to 1,800 ft2. The average annual property tax for Congress Park is $5,959.41. It is located in Cook County. Congress Park is a single family home subdivision. Congress Park is located in Brookfield, Illinois south of Ogden and west of Maple Avenue.
... Read more
|
Median Price: $400,000 |
Show all 15 Subdivisions/Buildings
Subdivisions/Buildings
View subdivisions in Brookfield
Market Trends
Brookfield home sales for the month of January stayed the same in volume when compared to last year, while the median sale price rose by 11.8% from $340,000 to $380,000. House sales rose by 18.2%, while the median sale price rose by 4.1% from $365,000 to $380,000.
|
257
|
219
|
168
|
189
|
|
2022 |
2023 |
2024 |
2025 |
|
$308,000
|
$335,000
|
$349,450
|
$369,000
|
|
2022 |
2023 |
2024 |
2025 |
Median Sale Price for Brookfield
Number of Sales for Brookfield
Market Trends
View market trends in Brookfield
Nearby Parks
28th Street & Park Avenue
Basketball Courts
Field
Playground
Trails
Burlington Avenue and Grove
Playground
Shields Avenue and Elm
Baseball Diamonds
Basketball Courts
Playground
Soccer Fields
Softball Fields
Tennis Courts
Volleyball Courts
Harrison Avenue
Playground
8820 Brookfield Avenue
Baseball Diamonds
Basketball Courts
Playground
Softball Fields
Volleyball Courts
Madison Avenue
Playground
Madison Avenue and Lincoln
Grand Boulevard and Sunnyside Avenue
Show all 10 parks
Nearby Parks
View parks in Brookfield
Real Estate News
|
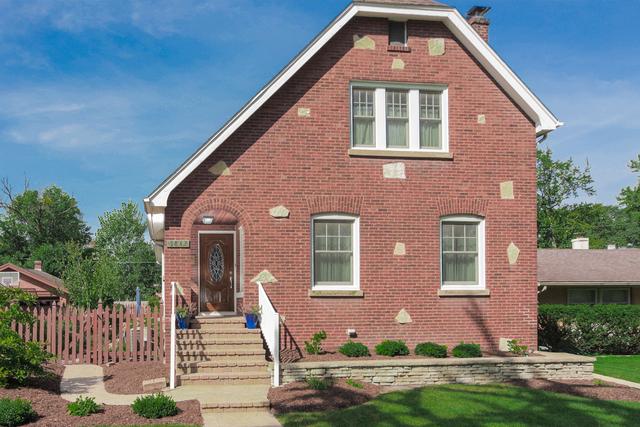
Brookfield had 2 new homes for sale during the week of Friday, February 13 to Thursday, February 19, including including 1 single family home for sale with a list price ...
continue reading
|
|
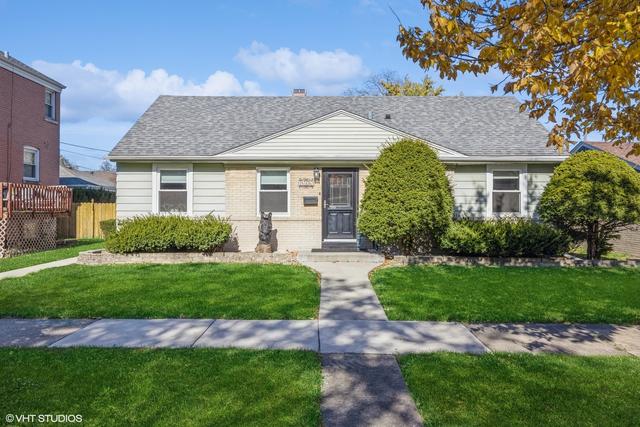
Brookfield had 3 sales during the week of Tuesday, February 10 to Monday, February 16, including including 3 single family homes for sale with an average list price of $378,300.
$440,000
4138 ...
continue reading
|

|
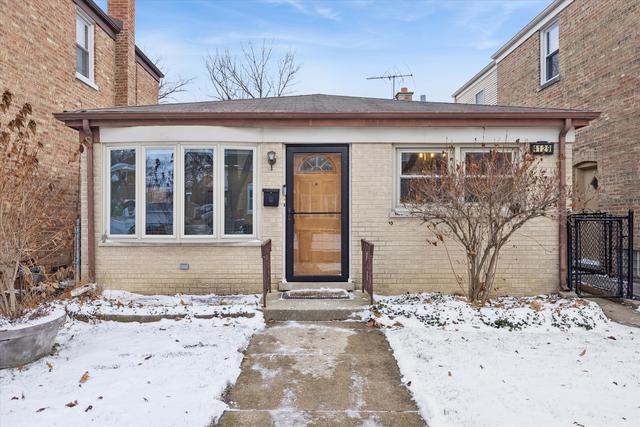
Brookfield had only 1 sale during the week of Tuesday, February 3 to Monday, February 9, including and it was a single family home for sale with a list price ...
continue reading
|
|
Brookfield had 3 new homes for sale during the week of Friday, January 30 to Thursday, February 5, including including 3 single family homes for sale with an average list ...
continue reading
|
|
Brookfield had 5 sales during the week of Tuesday, January 27 to Monday, February 2, including including 5 single family homes for sale with an average list price of $389,800.
$475,000
4422 ...
continue reading
|
View More Brookfield News
Real Estate News
View More Brookfield News
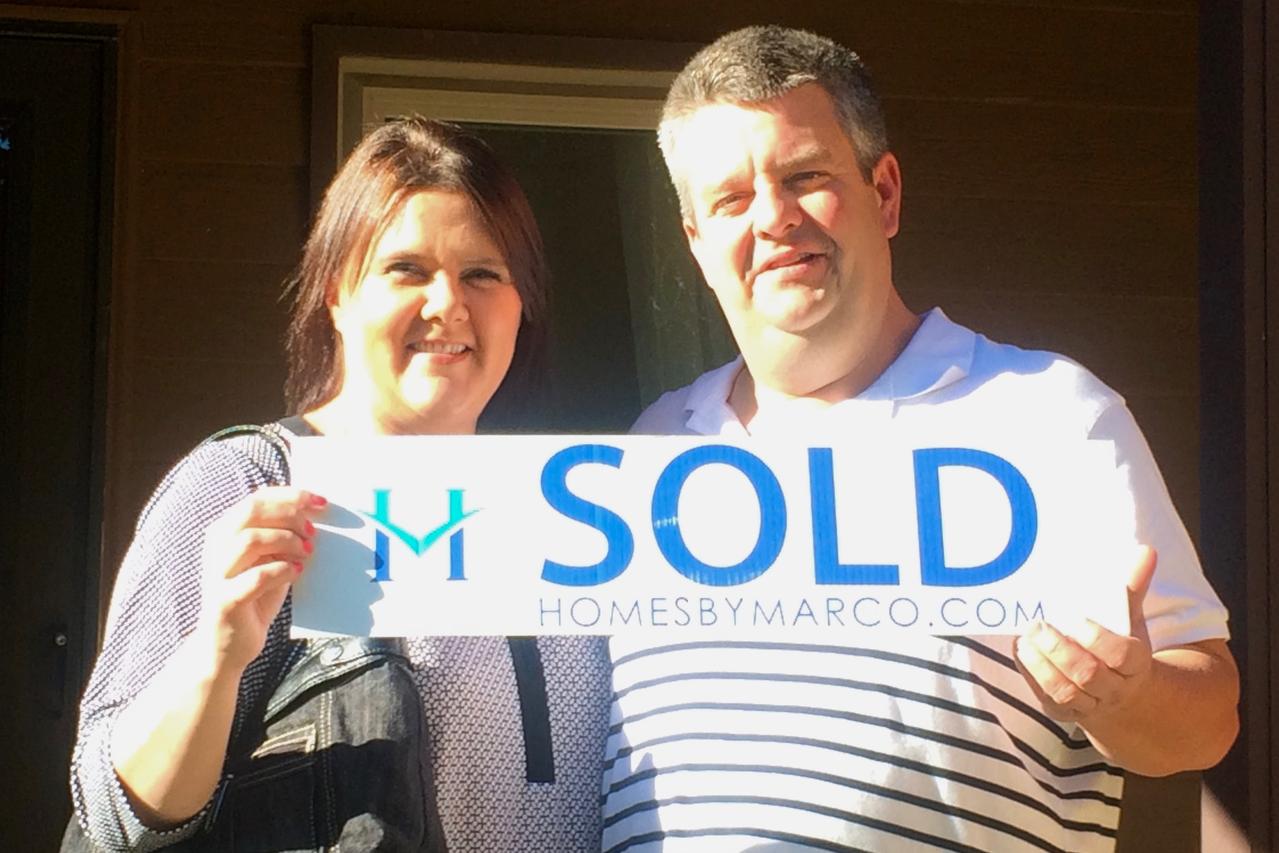
We have helped thousands of families buy and sell homes!
HomesByMarco agents are experts in the area. If you're looking to buy or sell a home, give us a call today at 888-326-2726.