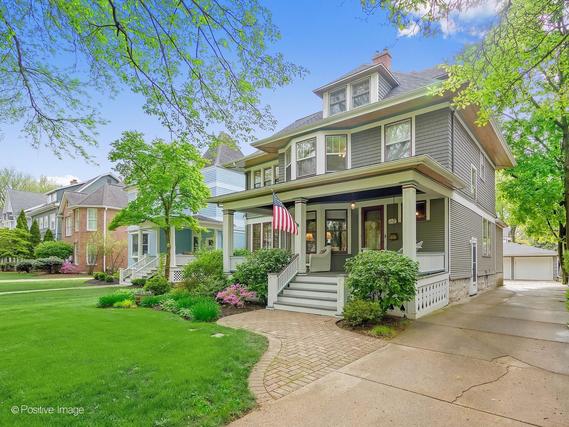
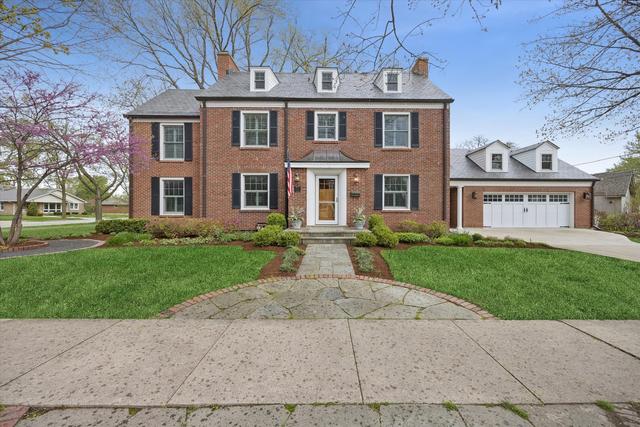
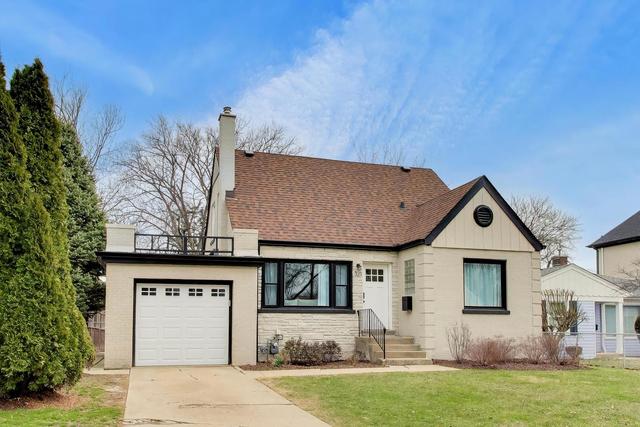
La Grange, IL, Real Estate
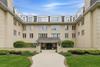
La Grange, Illinois, is a charming village located in Cook County, just 13 miles west of downtown Chicago. Known for its tree-lined streets, historic architecture, and vibrant downtown, La Grange offers a perfect blend of small-town charm and urban accessibility. The village boasts a strong sense of community, with local events like the annual Pet Parade and farmers' markets fostering connection among residents. Its well-preserved historic district features unique shops, restaurants, and the iconic La Grange Theatre, while excellent schools and parks make it a family-friendly destination. With convenient access to Chicago via the Metra rail system, La Grange is an ideal spot for those seeking a suburban lifestyle with city proximity.
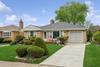
La Grange currently has 29 single family homes for sale with an average list price of $1,062,616.86, 5 townhouses for sale with an average list price of $508,760, 12 condos for sale with an average list price of $234,416.58, and 2 lots for sale with an average list price of $675,000. The average annual property tax for La Grange is $10,283.52.
Schools
View schools in La Grange
Using the absorption rate, we can determine how long it's taking for homes to sell and which price points are selling the fastest in La Grange, i.e. what's hot and what's not.
See What's Hot & What's Not in La Grange
Recent Sales
View recent sales in La Grange
Train Stations
View train stations in La Grange
Buildings/Subdivisions
|
Buildings/Subdivisions |
Median Price |

|
111 E. Cossitt is a condo building in La Grange, Illinois, built in 1975. It currently has no homes for sale. The homes range in size from 1,000 ft2 to 1,715 ft2. The average annual property tax for 111 E. Cossitt is $4,302.42. It is located in Cook County. 111 E. Cossitt is a 14 unit condo building built in the early 1970's. 111 E. Cossitt is located in La Grange, Illinois east of La Grange Road.
... Read more
|
|
|
|
17 N. Madison is a condo building in La Grange, Illinois, built in 1984. It currently has no homes for sale. The HOA fees range from $207 to $353 per month. The average annual property tax for 17 N. Madison is $4,866.18. It is located in Cook County. 17 N. Madison is a 10 unit condo building built in the mid 1980's. 17 N. Madison is located in La Grange, Illinois on Madison Avenue south of Ogden Avenue.
... Read more
|
Median Price: $328,000 |
|
|
26 6th Ave is a condo building in La Grange, Illinois. It currently has no homes for sale. The average annual property tax for 26 6th Ave is $2,236.57. 26 6th Avenue is a 7 unit vintage condo building. 26 6th Avenue is located in La Grange, Illinois on 6th Avenue north of Harris Avenue and east of La Grange Road.
... Read more
|
|
|
|
27 S. Waiola is a condo building in La Grange, Illinois, built between 1968 and 1971. It currently has no homes for sale. The homes range in size from 1,000 ft2 to 1,100 ft2. The HOA fees range from $330 to $330 per month. The average annual property tax for 27 S. Waiola is $2,716.78. It is located in Cook County. 27 S. Waiola Avenue is a 12 unit condo building built in 1968. 27 S. Waiola Avenue is located in La Grange, Illinois north of Cossitt Avenue and west of La Grange Avenue.
... Read more
|
Median Price: $229,000 |
|
|
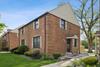
28 S. 6th is a condo building in La Grange, Illinois, built in 1924. It currently has 1 condo for sale with a list price of $195,500. The HOA fees range from $555 to $609 per month. The average annual property tax for 28 S. 6th is $2,582.27. It is located in Cook County. 28 S. 6th Avenue is a 36 unit vintage courtyard condo building built in the early 1920's. 28 S. 6th Avenue is located in La Grange, Illinois east of La Grange Road and north of Harris Avenue.
... Read more
|
Median Price: $187,500 |
Show all 27 Buildings/Subdivisions
Buildings/Subdivisions
View subdivisions in La Grange
Market Trends
La Grange home sales for the month of April rose in volume by 50% when compared to last year, while the median sale price decreased by 8.9% from $532,500 to $484,888.50. House sales rose by 37.5%, while the median sale price decreased by 21.2% from $660,000 to $520,000. Condo sales rose by 200%, while the median sale price rose by 35.3% from $169,250 to $229,000. Townhouse sales decreased by 50%, while the median sale price rose by 56.4% from $383,750 to $600,000.
|
278
|
224
|
214
|
194
|
|
2022 |
2023 |
2024 |
2025 |
|
$545,000
|
$511,250
|
$566,250
|
$547,450
|
|
2022 |
2023 |
2024 |
2025 |
Median Sale Price for La Grange
Number of Sales for La Grange
Market Trends
View market trends in La Grange
Nearby Golf Courses
7500 Willow Springs Rd, La Grange, IL 60525
Par 72 • 72 holes • 6711 yards
620 S Brainard Ave, La Grange, IL 60525
Par 71 • 71 holes • 6685 yards
Nearby Golf Courses
View golf courses near 28 S. 6th
Real Estate News

|
La Grange had only 1 sale during the week of Tuesday, May 12 to Monday, May 18, including and it was a single family home for sale with a list ...
continue reading
|
|
La Grange had 3 new homes for sale with a master bedroom on the first floor during the month of Saturday, May 9 to Friday, May 15, including 2 ...
continue reading
|

|
La Grange had 6 new homes for sale during the week of Friday, May 8 to Thursday, May 14, including including 5 single family homes for sale with an average ...
continue reading
|
|
La Grange had only 1 new home for sale with a master bedroom on the first floor during the month of Saturday, May 2 to Friday, May 8, and ...
continue reading
|
|
La Grange had 3 new homes for sale during the week of Friday, May 1 to Thursday, May 7, including including 1 single family home for sale with a list ...
continue reading
|
View More La Grange News
Real Estate News
View More La Grange News
We have helped thousands of families buy and sell homes!
HomesByMarco agents are experts in the area. If you're looking to buy or sell a home, give us a call today at 888-326-2726.